Profitability & cost allocation
Understand profitability by product, customer, channel or service. Model direct and shared costs through governed drivers and trace how each allocation contributes to the result.
Trace what drives profitability, compare scenarios and report on business performance. Use Optimus AI and governed workflows to help turn your analysis into action.
Build living models around the economics of the business—not around the layout of a spreadsheet someone inherited.
Understand profitability by product, customer, channel or service. Model direct and shared costs through governed drivers and trace how each allocation contributes to the result.
Keep actual, budget, forecast and management scenarios comparable. Test price, volume, mix, productivity, capacity and investment assumptions without multiplying workbook copies.
Organise business structures the way leaders manage them. Reuse governed dimensions across inputs, calculations, model views and reports.
Plan operational volumes, rates and resource drivers alongside revenue and cost. Use forecasting techniques and controlled assumptions to see their impact on profitability.
Capture planning assumptions in governed grids with ownership, role-aware access and a visible audit path—then incorporate them directly into the model.
Use Optimus AI to inspect context, propose analysis, assist with structured updates and run approved scenario workflows under enterprise controls.
Bring profitability, performance, cost analysis and sales insight into a consistent view across your business and teams.
Use 3D asset maps to put the operational and cost drivers behind your profitability views in a physical context. The aircraft demonstration connects component maintenance expense, cargo-zone utilisation and the tables behind each view.
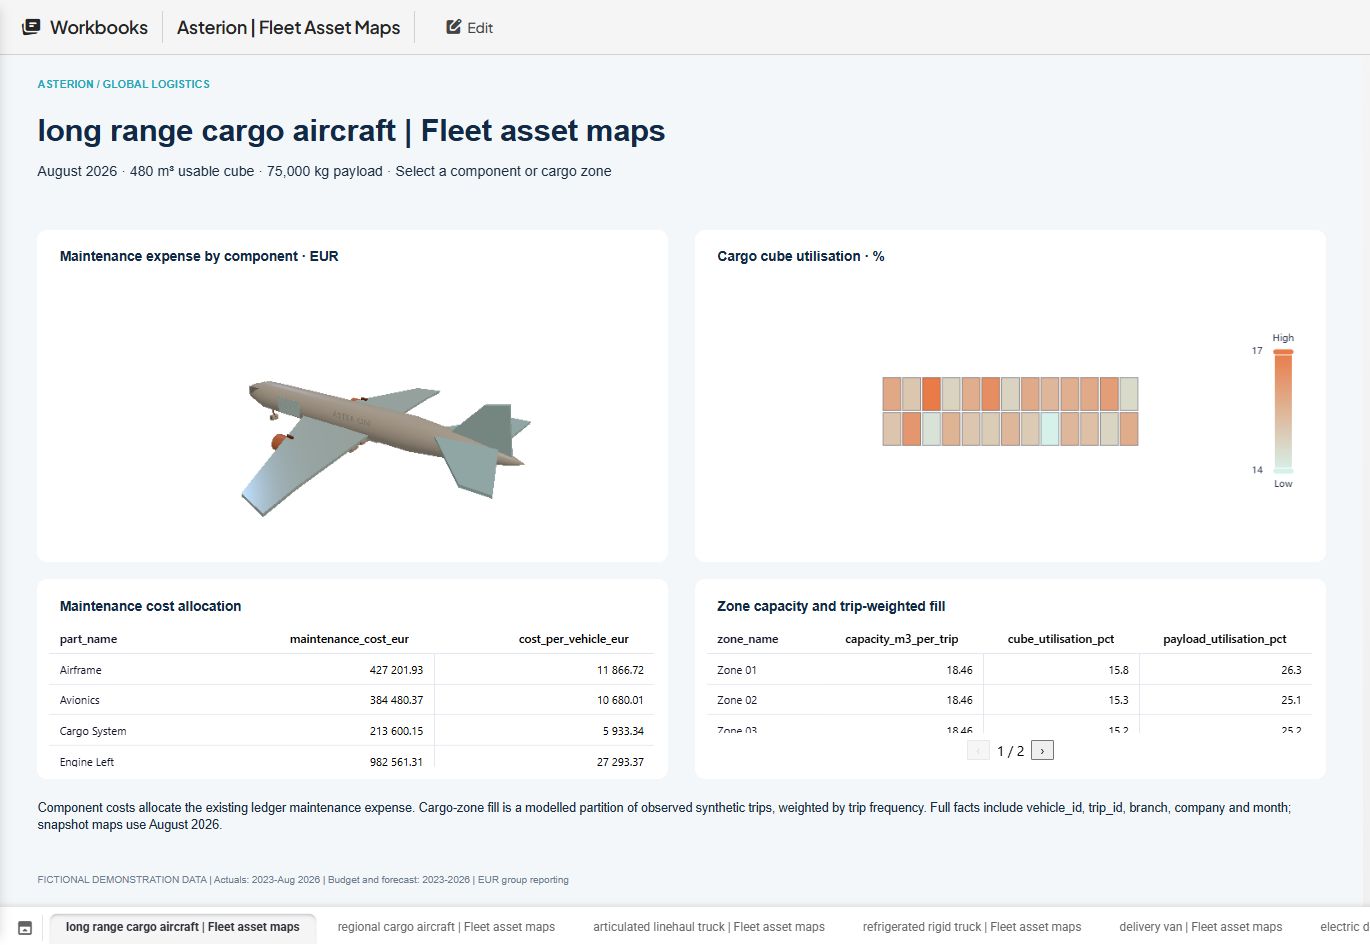
Asterion demonstration workspace · October 2026 product capture.
Replace hand-assembled checklists with workflows that load, calculate, publish, notify and protect the workspace on schedule.
Refresh source data and validate that the expected inputs arrived.
Run models, allocation logic and scenario calculations.
Update governed reports, views and executive outputs.
Inform stakeholders through email, Microsoft Teams or Slack.
Export or back up workspaces and log the completed run.
Branch when data is missing, extend into wider systems with controlled HTTP steps and keep stakeholders informed when a task needs intervention.
Generate commentary, inspect a variance pattern or prepare a recurring briefing using the approved context, model and tool boundary of the workspace.
Full design, collaboration, administration and consumption for hosted or on-premises environments.
Work with local or hosted workspaces, including patterns for disconnected or tightly controlled environments.
Connect, refresh and push workbook data into your profitability views using the Excel tools your teams already know.
We will demonstrate how OptiFI can turn it into a governed, repeatable operating asset.