Connect
Connect operational, revenue and cost data to build consistent profitability views.
OptiFI brings profitability analysis, performance reporting, scenario planning and Optimus AI into one workspace. Connected data, profitability models and workflows give every decision a shared foundation.
Every stage remains connected to the same workspace, governance and business context.
Connect operational, revenue and cost data to build consistent profitability views.
Encode allocations, drivers, scenarios, plans and hierarchies.
Publish interactive, role-aware views for every audience.
Use Optimus AI to analyse drivers in their governed context.
Automate refresh, calculation, delivery, action and recovery.
OptiFI keeps the same identity, permissions, lineage and operating controls around the entire analytical lifecycle. Teams collaborate in real time; leaders explore live; administrators retain control.
Import and query databases, files, Microsoft Graph-connected content, SAP HANA, cloud storage and model outputs. Use cross-source joins without waiting for a multi-year warehouse programme.
Explore data connectivity →Build costing, allocation and planning models. Manage dimensions and hierarchies, plan volumes and compare actual, budget and forecast versions.
Explore profitability modelling →Design with tables, matrices, sheets and a rich visual library. Reuse datasets, parameterise views and align row visibility with organisational roles.
Explore reporting →Orchestrate load, calculate, publish, notify, export, back up and run governed agent prompts—on schedules or triggered by wider systems.
Explore automation →Optimus AI uses the objects, rules and approved context your teams already trust, with customer-environment model options and logged actions.
Explore Optimus AI →Use the web client for full collaboration, the desktop app for local or hosted workspaces, and the Excel add-in to connect, refresh and push workbook data.
See it in action →Bring profitability, performance, cost analysis and sales insight into a consistent view across your business and teams.
Explore the workbook designer and asset analytics in the current OptiFI interface. Screens below use the Asterion demonstration workspace.
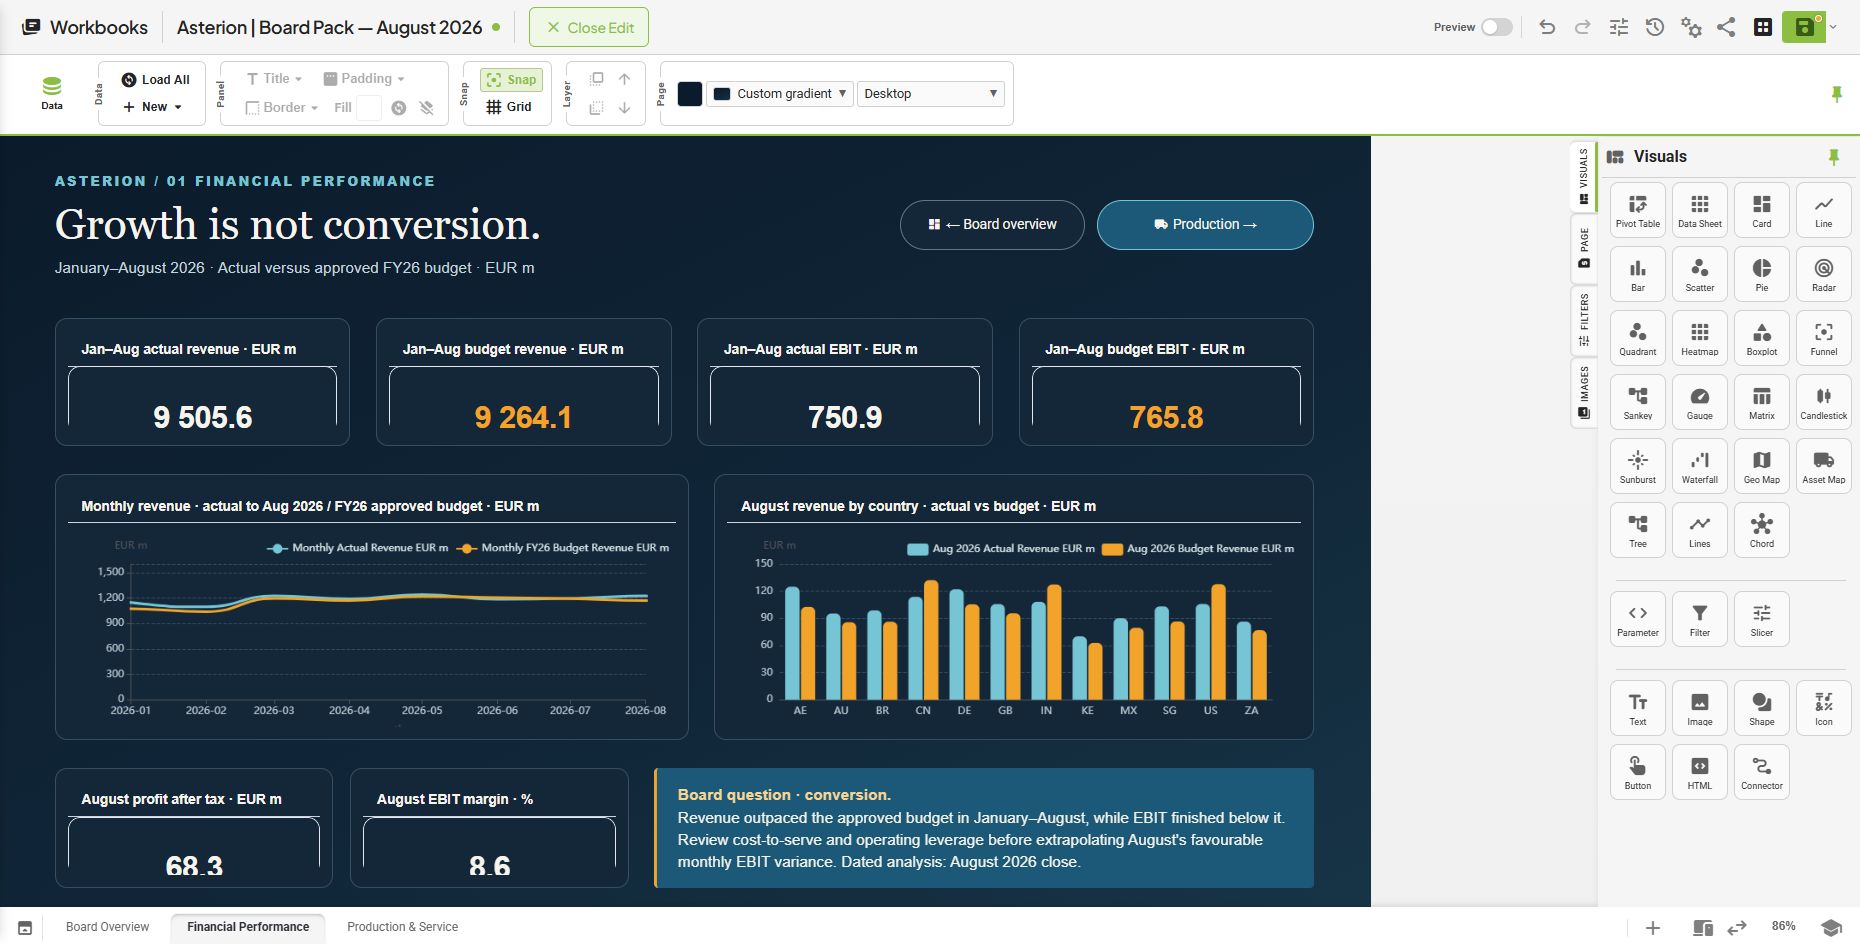
Combine profitability views, tables, text and navigation across workbook pages. Choose from visuals including waterfall, Sankey, geo maps and asset maps.
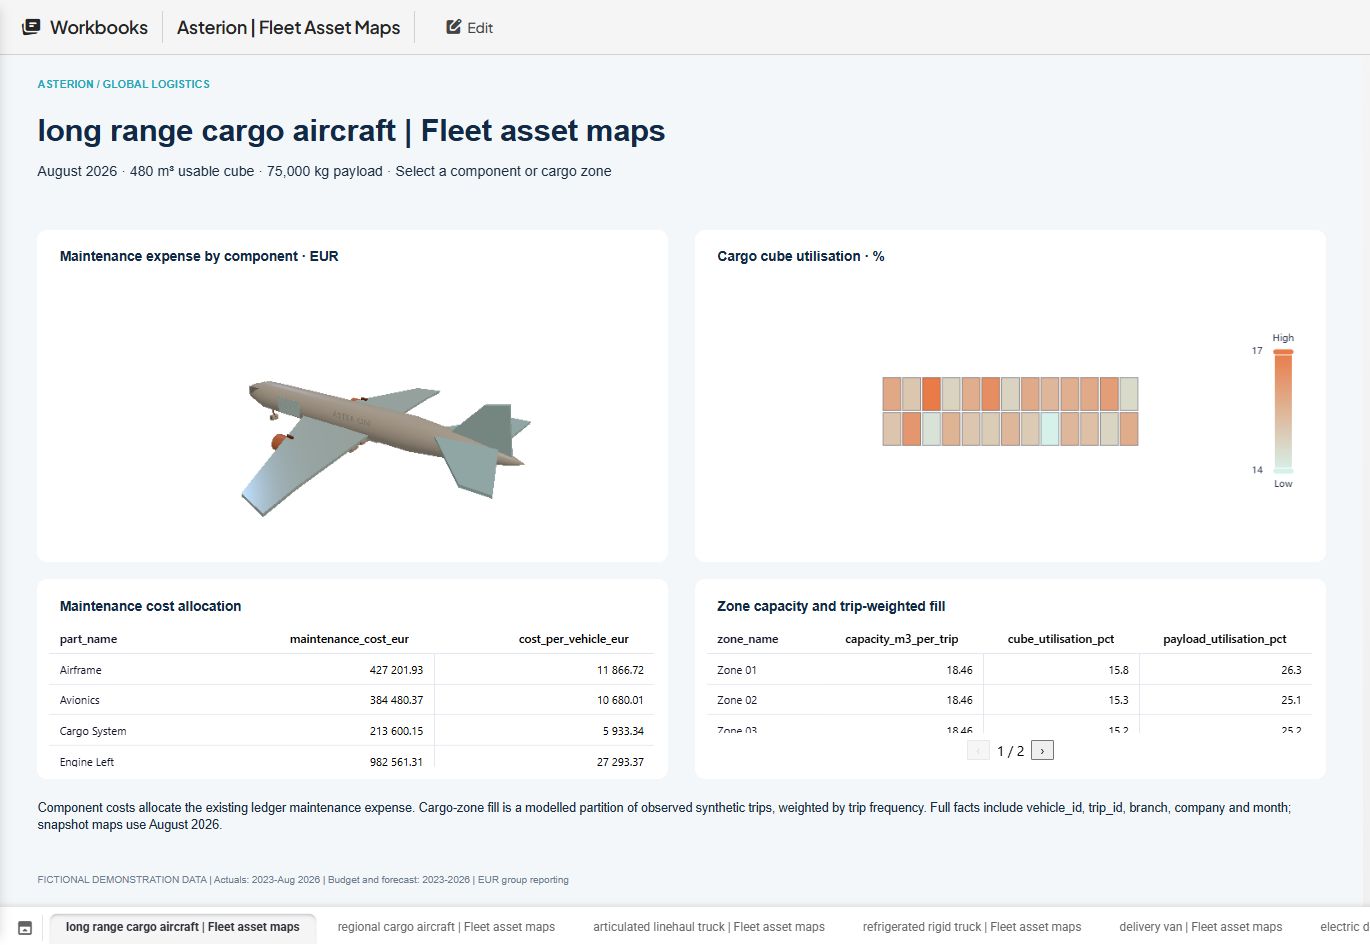
Explore a 3D aircraft alongside component maintenance costs and cargo-zone utilisation. Cost and utilisation measures give your profitability views a physical context.
Actual OptiFI screens captured October 2026 · Asterion demonstration data · Select an image to view at full size.
We will trace it from source landscape through modelling, reporting, Optimus AI and the workflow that keeps it current.